NIWA DataHub
National sea-level rise flood spatial data
National sea-level rise flood spatial data
Couldn't load pickup availability
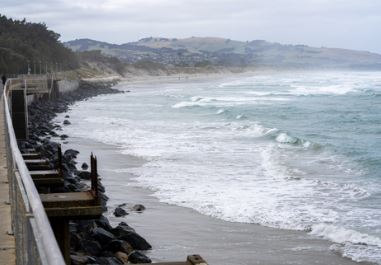
We build our maps of sea level flooding from analysis of sea-level measurements and numerical models and we have verified the results against sea-level run-up observations collected after large storm-tide events. This sea-level rise flood dataset comprise 9 extreme coastal flooding scenarios (2, 5, 10, 20, 50, 100, 200, 500 and 1000-year average recurrence interval) and 21 relative sea-level rise scenarios ranging from 0 to 2 metres in 10 cm (0.1 m) increments. Our maps are created using a Geographic Information System (GIS). As a result, we can make attractive images and provide valuable climate information as digital layers to be incorporated into your specific project.
More Information on NIWA's sea-level rise products and services can be found here.
This webpage provides access to national sea-level change data for 21 sea-level rise scenarios (SLR) and 100 year average recurrence intervals (ARI). The access is provided at no charge for non commercial use only.
Please acknowledge or cite the Extreme sea level flood maps (1% AEP and up to 2m sea-level rise) for Aotearoa by referencing this publication as appropriate:
Paulik, R., Wild, A., Stephens, S., Welsh, R., Wadhwa, S. (2023) National assessment of extreme sea-level driven inundation under rising sea levels. Frontiers in Environmental Science, 10, 2633, https://doi.org/10.3389/fenvs.2022.1045743.
Geospatial visualisation of the national 100 year ARI dataset can be found on NIWA's flood map ArcGIS tool.
Regional datasets for other ARIs can be found here.
If you need other data or licence arrangements, please lodge a request through data enquiries.
Share